East Region Prime: Gannett Flemming TransSystems (GFT - Formerly Dannenbaum)
Texas General Land Office (GLO) Combined River Basin Flood Studies
Ongoing
The Challenge
The Water Institute has partnered since 2020 with the RBFS East Region Study Vendor (Gannett Flemming Transystems or GFT) as a subconsultant to perform engagement, modeling, and analysis for the prioritized coastal watersheds surrounding East Galveston Bay (Figure 1).
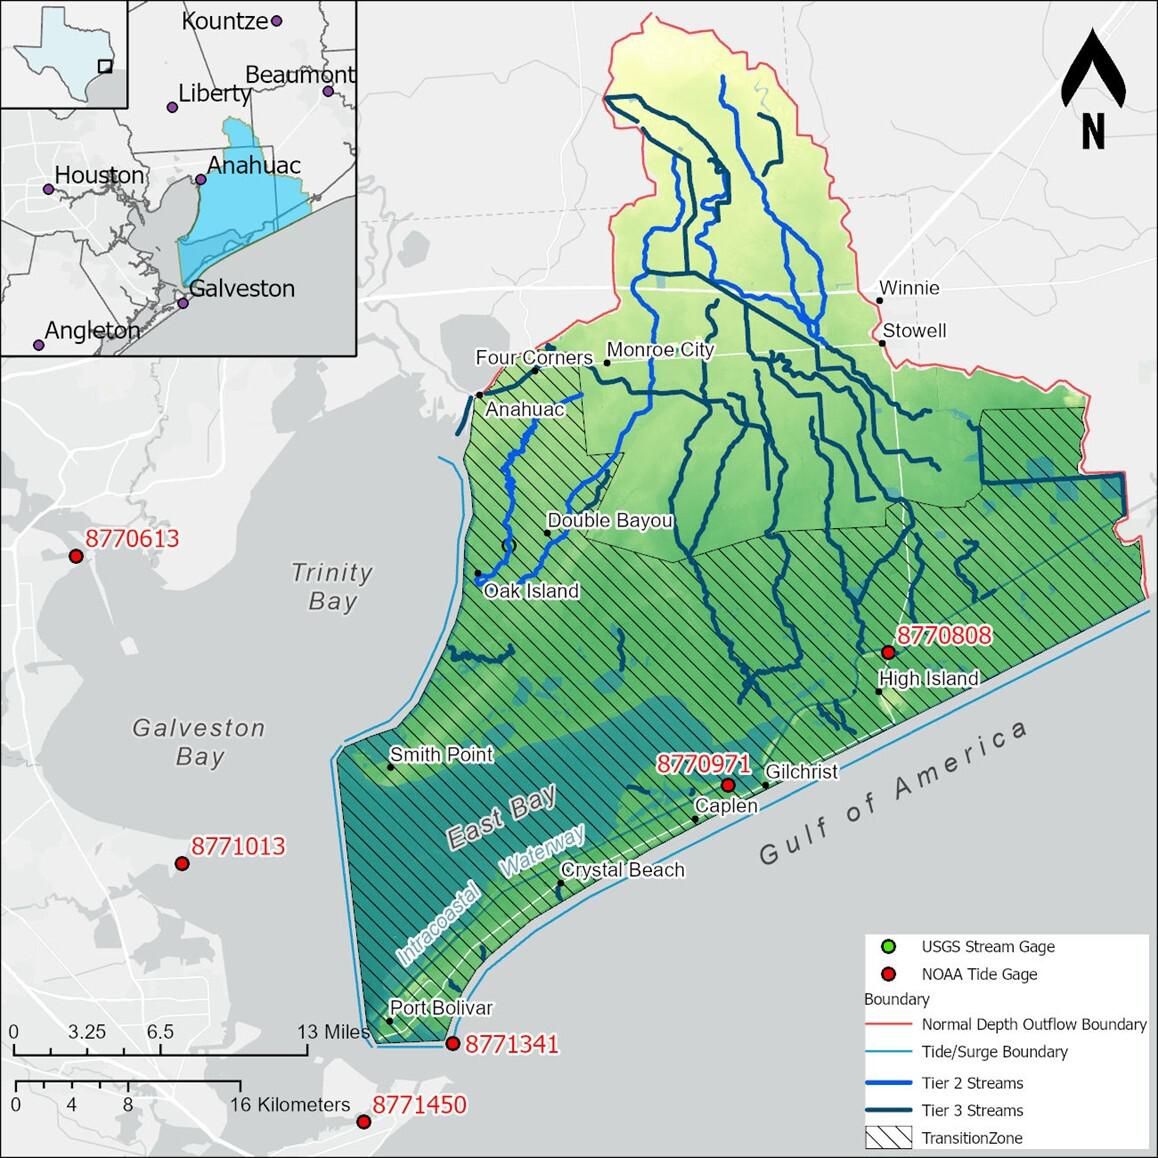
Figure 1 The East Galveston Bay study area is a 734 square mile portion of the watershed boundary. Per the Phase 3 SOP the streams were classified as Tier 2 and Tier 3 streams which are defined as medium and low detail streams respectively.
Initially subcontracted by Dannenbaum (as they were then known) in 2020, the first two phases of RBFS planned and executed extensive outreach and data collection efforts so that community interests and best available data would be represented in the flood models. Phase 2 included the coordination of a comprehensive Flood Model Development Plan (FMDP).
The Water Institute was subsequently subcontracted in 2022 by then-DEC under Phase 3 to build a baseline existing conditions model for the coastal regions, and a hot spot analysis was conducted to prioritize areas for consideration to advance to Phase 4.
In 2025, The Water Institute was again subcontracted under Phase 4 to conduct the coastal region Alternatives Analysis, which will identify innovative, regional, or otherwise new opportunities to improve flood resilience for identified hot spots from Phase 3.
The Water Institute’s East Galveston Bay Study Area encompasses 4 Hydrologic Unit Code-10s (HUC-10s) that were merged into a single model domain:
- East Fork Double Bayou-Trinity Bay
- Cane Bayou
- Spindletop Bayou
- Oyster Bayou
Four storm frequencies were evaluated in this study, the 10-, 50-, 100-, and 500-year Annual Exceedance Probability (AEP) events.
Coastal regions such as the one studied by The Water Institute for RBFS are affected by both pluvial flooding with significant rainfall and surge flooding in a tropical storm. To account for the composite effect of these flooding regimes during a significant hurricane event, The Water Institute applied the results of a bivariate analysis to the hydrodynamic model in order to better understand the variability and extent of coastal inundation in these extreme situations.
Bivariate Analysis:
A bivariate analysis was conducted by the University of Iowa to identify 1) correlations between surge and rainfall and 2) to identify combinations of surge and rainfall representative of specific AEP. For each AEP, the bivariate analysis produced 3 events, described as most likely, surge-dominated (right) and rainfall-dominated (left). Atlas-14 precipitation events corresponding to each AEP were also evaluated.
This effort also produced spatio-temporal precipitation fields for these events for each AEP. The coastal boundary condition for each event was developed by scaling the ADCIRC-derived storm surge timeseries for a chosen historical storm. The scaling factors and the appropriate historical storm were developed as part of the bivariate analysis.
To represent the compound flooding at the coast in the model, The University of Iowa conducted a coastal bivariate analysis of the correlations between surge and rainfall across the Texas coast. This analysis identified combinations representative of a specific Annual Exceedance Probability (AEP) or return period (Figure 2).
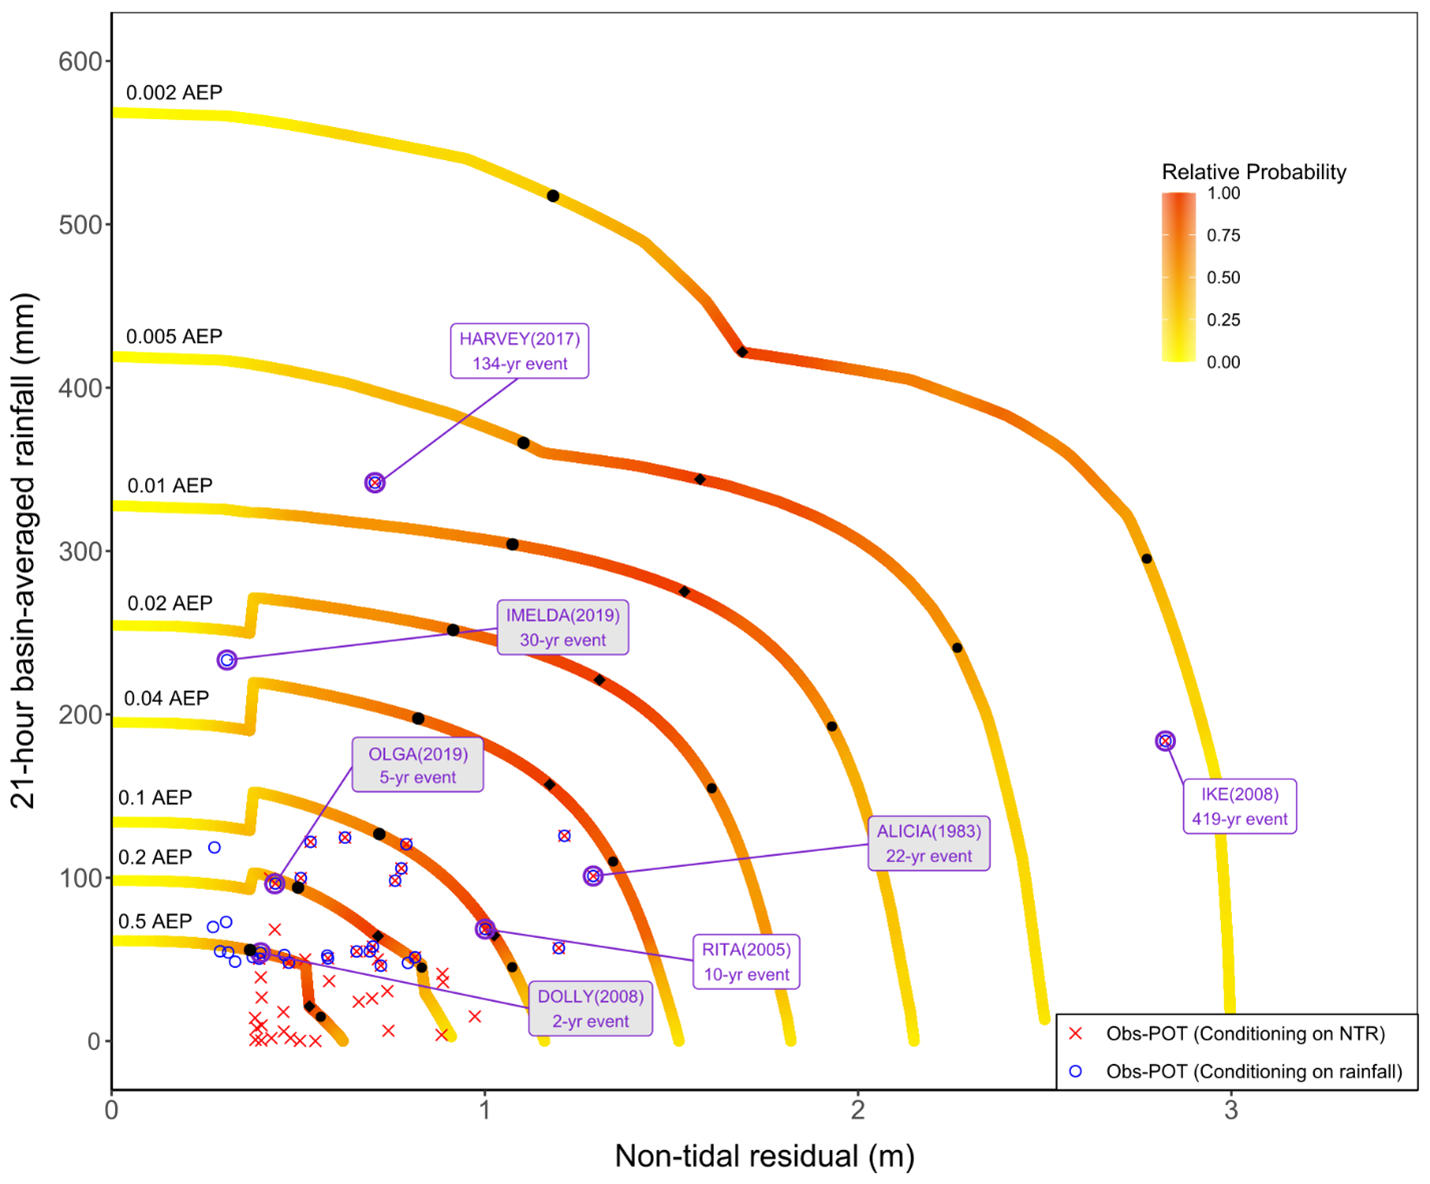
By plotting storm rainfall and surge totals on the graph, each storm is assigned a return period, and the storms closest to each of the AEP lines is used as the “design storm” for that AEP event. For each AEP line, points are identified that represent the rainfall-surge pairing that is statistically most likely as a rainfall-dominated event, a surge-dominated event, or overall most likely event.
To model an event type at a particular AEP, the design storm’s actual rainfall and surge are scaled according to its location on the graph relative to the statistically generated point. These scaling factors are then applied to the spatio-temporal rainfall inputs and the ADCIRC input time series to represent the desired event type and frequency.
Each of these event types, along with an Atlas-14 rainfall-only event, were modeled at each AEP for a total of 16 discrete model runs to describe the variability and uncertainty inherent in compound flooding.
The Texas General Land Office (GLO) issued a solicitation to develop a $100 million planning study, consisting of four regionalized studies based on Texas' major river basins, to evaluate mitigation and abatement strategies to reduce disaster impacts and increase community resiliency.
The Approach
The Combined River Basin Flood Study is composed of five main phases described below. Each phase is guided by Standard Operating Procedures (SOPs) that were developed in a previous Study phase by Study participants and validated by the US Army Corps of Engineers or a designated independent review firm.
Phase 1: Data Collection and Stakeholder Engagement Planning
This phase established a framework for consistent data collection and stakeholder engagement while ensuring coordination with federal, state, and local stakeholders. These foundational activities provided a robust framework for the study's progression.
Phase 2: Data Collection and Stakeholder Engagement
Through surveys, follow-ups, and workshops, extensive local and regional flood risk data were collected and validated. A Data Quality Management Plan (DQMP) was developed to ensure the reliability of the data, while data gaps were analyzed to guide additional collection needs. Preliminary data sets were used to begin model development, and stakeholder engagement efforts facilitated improved collaboration and data sharing. This phase concluded with a prioritized list of 38 Hydrologic Unit Code (HUC) 10 areas requiring enhanced flood modeling in subsequent phases, four of which were assigned to The Water Institute.
Phase 3: Flood Model Development
High-resolution hydrologic and hydraulic models were created for the prioritized areas identified in Phase 2 and refined using validated data. These models have provided critical insights into flood risks, and thus the output from this phase serves as the basis for evaluating potential mitigation strategies in the next phase. Phase 3 concluded in April, 2025.
Phase 3 included a Hot Spot Analysis to evaluate flood exposure to structures, roadways, and agricultural areas using geospatial data, flood modeling outputs, and social vulnerability indices. This GIS-based approach used flood modeling outputs to assess exposure and aggregated results into spatially defined hot spots. By analyzing structural, roadway, and agricultural flood exposure alongside socioeconomic vulnerability, the analysis provided a comprehensive understanding of high-risk areas that were used to refine mitigation analysis efforts and direct resources for Phase 4.
Phase 4: Alternatives Analysis and Benefit-Cost Analysis
Phase 4 is currently underway to conduct alternatives analysis and benefit-cost analysis to evaluate potential flood mitigation projects. By analyzing the effectiveness and cost-efficiency of various strategies, this phase will help prioritize projects for funding and implementation. The outcomes of this phase will form the basis for actionable recommendations in Phase 5.
Phase 5: Recommendations and Pursuit of Mitigation Funds
The final phase will consolidate all findings into a comprehensive set of recommendations for flood mitigation projects. In addition to finalizing the proposed strategies, efforts will be made to secure funding from state and federal sources, including grants, to ensure project implementation. The culmination of these efforts will result in actionable solutions to reduce flood risks and improve community resilience.
KEY TEAM MEMBERS